Introduction
Welcome
This survey presentation will focus on developing Python projects with Visual Studio Code (VS Code) on the Raspberry Pi. The principles demonstrated can be applied to other languages supported by the Pi and other SBC.
Topics
- Integrated Development Environments (IDEs)
- Visual Studio Code
- Installation
- User Interface
- Project Setup
- Git Integration
- Debugging
- Extensions
- Conclusion
Integrated Development Environments (IDEs)
An integrated development environment (IDE) is a comprehensive software application that combines project editing, debugging, version control, and other development tools into one platform. The code editor in an IDE typically offers features like syntax highlighting and autocompletion to enhance productivity. The built-in graphical debugger allows developers to set breakpoints, inspect variables, and step through their code for troubleshooting. Most IDEs include Git integration, providing a user-friendly interface for common version control tasks such as staging, committing, pushing, and pulling. Additionally, IDEs often support multiple programming languages and can be extended with plugins or extensions to include a wide range of development tools.
https://en.wikipedia.org/wiki/Integrated_development_environment
Visual Studio Code
Why VS Code? Popularity. In the 2023 Python Software Foundation and JetBrains and Stack Overflow developer surveys, VS Code was the most used IDE.
Pros
- Based on the “Visual Studio Code — Open Source” program, created by Microsoft under an MIT license and hosted on GitHub.
- Support for Python and other popular languages via extensions.
- Remote SSH, Docker, and Windows Subsystem for Linux (WSL) integration using extensions.
- Java is not required to run.
Cons
- VS Code is developed by Microsoft and has some proprietary components.
- Extensions may contain malicious code (VSCode extensions with malicious code installed 229M times).
- Marketplace includes some extensions that require a subscription (paid/free).
- Slow load times when using certain extensions.
- Raspberry 4 or higher recommended.
Alternative Popular IDEs
Here is a table of the most popular IDEs, that support Python and can run on the Raspberry Pi (4 or higher), based on the JetBrains and Stack Overflow surveys and Top IDE index. This list includes ‘true’ IDEs — single programs that unify project editing, debugging, and versioning at least.
| Name | Support |
|---|---|
| IntelliJ IDEA[1,2] | Linux, macOS, Windows |
| PyCharm CE[1,3] | Linux, macOS, Windows |
| Eclipse IDE[1,2] | Linux, macOS, Windows |
| Visual Studio Code[2] | Linux, macOS, Windows |
- Java required
- IDE specific Python extensions required
- Community Edition
Note: Running these IDEs on *BSD or non-Debian systems can be challenging due to limited support and potential compatibility issues, often requiring workarounds or manual setups.
Installation
Raspberry Pi
VSCode is officially distributed via the Raspberry Pi OS APT repository, in both 32-bit and 64-bit variants.
sudo apt update
sudo apt install code
https://code.visualstudio.com/docs/setup/raspberry-pi
Installation Instructions for Other Operating Systems
- FreeBSD: https://freebsdfoundation.org/resource/how-to-use-vs-code-on-freebsd/
- Linux: https://code.visualstudio.com/docs/setup/linux
- macOS: https://code.visualstudio.com/docs/setup/mac
- Windows: https://code.visualstudio.com/docs/setup/windows
Quick Start
A Raspberry Pi will be used for the remainder of the demonstration. Refer to the official VS Code documentation for instructions tailored to other operating systems.
- Open the Applications menu.
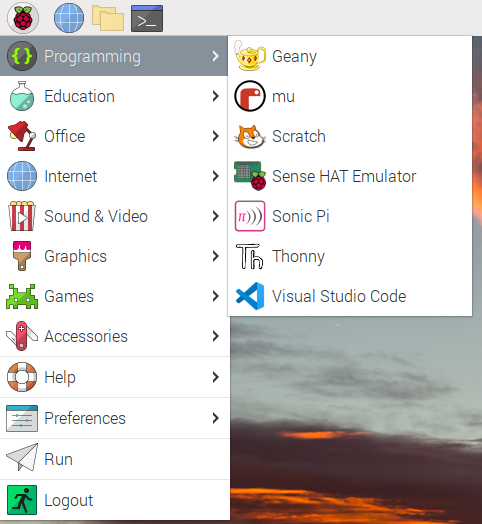
- Select Programming.
- Click Visual Studio Code.
User Interface
Major Elements
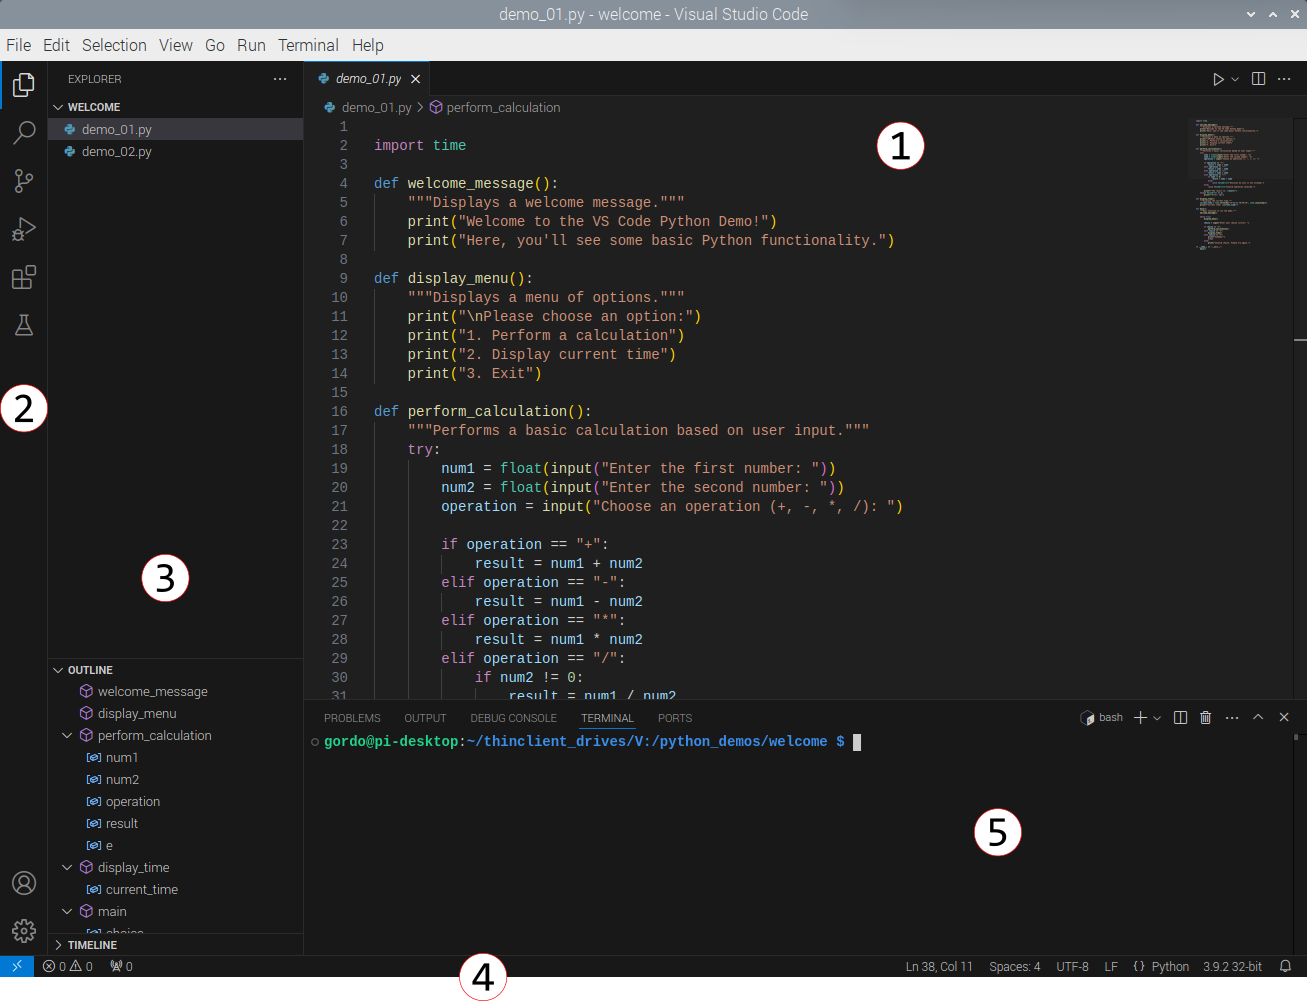
- Editor - the main area to edit files. You can open multiple files and each will have a tab at the top of the editor. You can also split the editor window vertically and horizontally. A mini
- Activity Bar - buttons that switch views. Some of these buttons will present context-specific indicators for your reference. (Extensions may install additional buttons.)
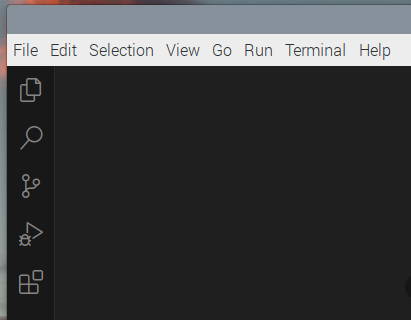
From top to bottom the icons are:
- Explorer
- Search
- Source Control
- Run and Debug
- Extensions
- Primary Side Bar - contains useful information related to the Activity Bar button you’ve selected.
- Status Bar - quick glance information about your the project you’re working on.
- Panel - a secondary area for output, debug information, errors and warnings, and an integrated terminal. (Not always shown.)
Let’s open a simple project (demo_01.py on GitHub) to demonstrate each element of the interface.
- Click on the Explorer button on the Activity Bar.
- Click the Open Folder button in the Primary Side Bar.
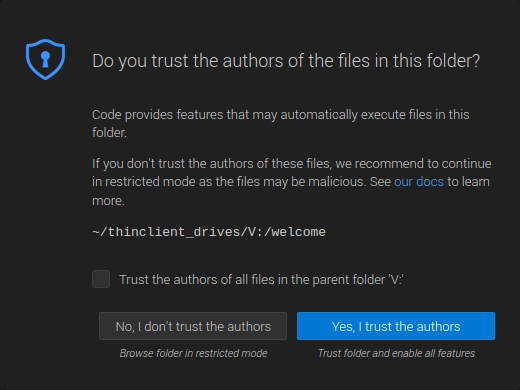
- Browse to and open your project folder. (You may see a message, “Do you trust the authors of the files in this folder?”, to protect you from malicious code. If you trust the source or have vetted the files, click “Yes, I trust the authors”.)
In the Explorer Primary Side Bar, you should see the following three major sections by default:
- Project folder name (all uppercase): contains all of your files and directories related to your project. (Toggle the > if it is collapsed.)
- Outline: shows the symbol tree of the currently active editor.
- Timeline: shows the history for a file, including local file saves and git commits.
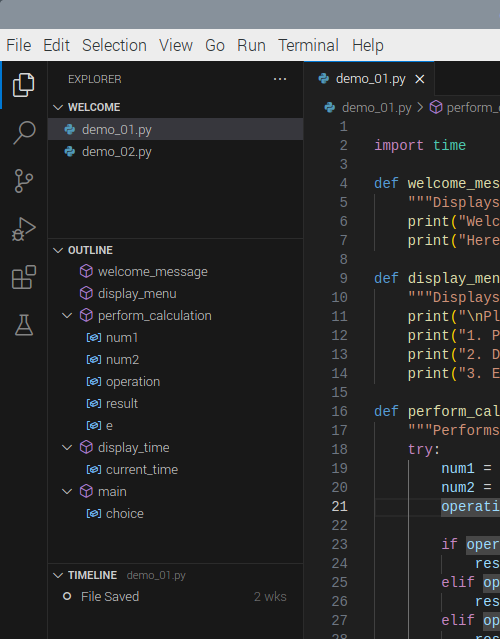
When you select a file in the Explorer section, a new tab will appear in the Editor with that file opened.
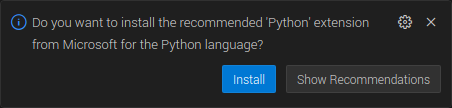
Since this is our first Python file opened, VS Code prompts us to install the recommended Python extensions. Let’s dismiss that notification to explore the default operation.
First thing you should notice is that your code is syntax highlighted and on the right you will see a Minimap, which gives you a high-level overview of your source code.
When you type more code, VS Code offers autocomplete suggestions, including references to your own code, such as variables and functions. Since you’ve edited the file, you should also see a circle with the number one above the Explorer Activity button to indicate you have one unsaved file.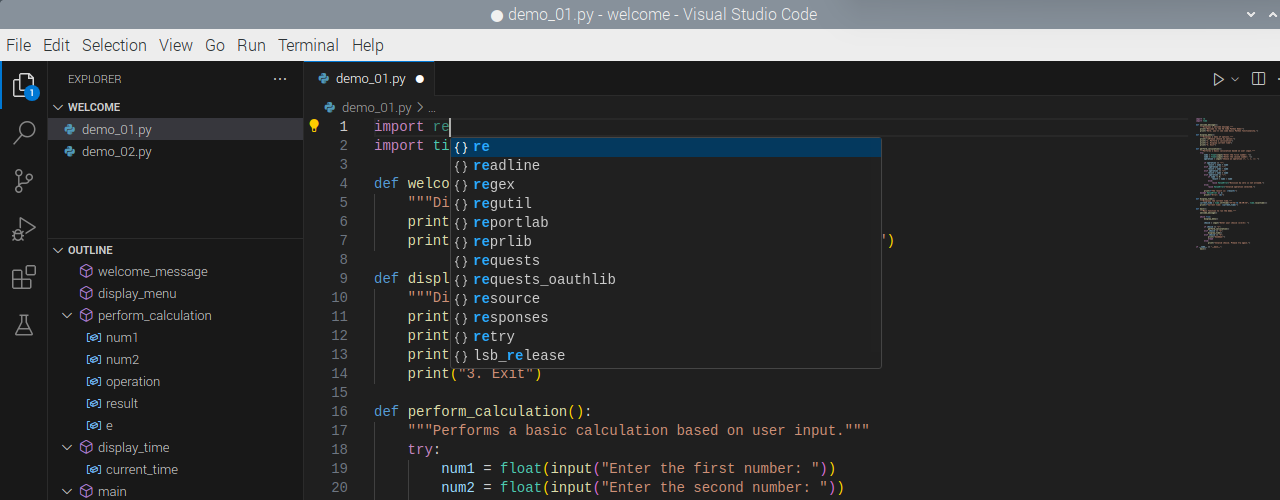
To provide a richer experience, we can install the Python extensions to add IntelliSense (Pylance), debugging (Python Debugger), formatting, linting, code navigation, refactoring, variable explorer, and more.
- Click on the Extensions Activity button.
- Type “Python” in the Search Extensions in the Marketplace text box.
- Click the Install next to the Python extension (developed by Microsoft) in the Popular or Recommended sections.
- Wait for the extensions to install. (The Python extension will install the Python Debugger and Pylance extensions as dependencies.)
(I’m also going to install the Vim extension to avoid mistakes.)
Clear the search field, and you should see the new extensions under the Installed section. We’ll explore more extensions near the end of the presentation.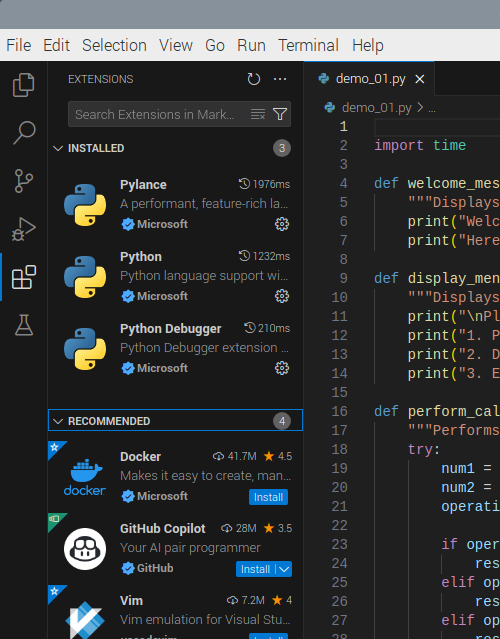
Return to the Explorer tab and select the demo Python file. With the Python extensions installed, a new ‘play’ icon will be available at the top-right corner of the Editor. Click it to run the current file.
Project Setup
Best practice for Python projects is to use a virtual environment and store your code in a repository.
Python Virtual Environment
With the Python extension installed, we can use VS Code to create a virtual environment.
- Click View and then click Command Pallett… or press
CTRL + SHIFT + P.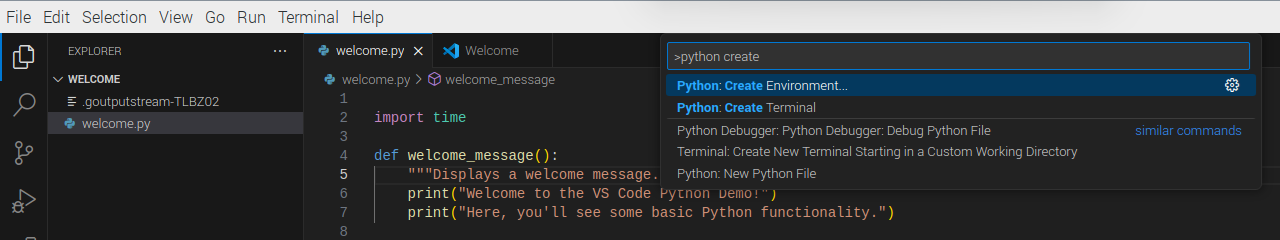
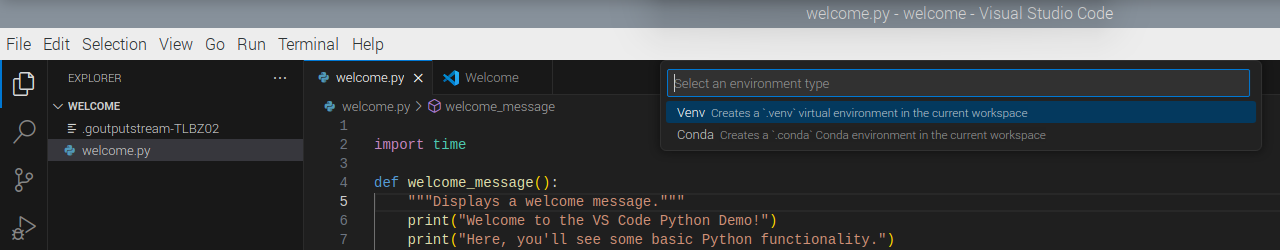
- Choose Venv in the drop-down under “Select an environment type…”
- Choose the entry with “Global” on the right side in the drop-down under “Select a Python installation to create the virtual environment”. (On the Raspberry Pi, there’s typically two entries,
/bin/pythonand/usr/bin/python/, and these are symbolic links to the Python included in the installation.)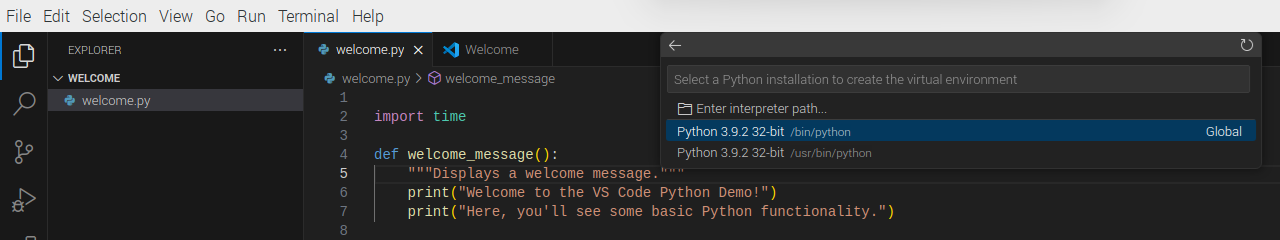
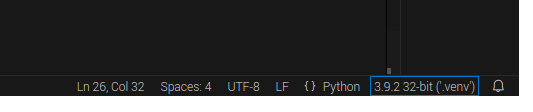
- Wait for it to create the virtual environment in your project directory. When it’s finished, VS Code should automatically switch to the new virtual environment. The selected environment is displayed in the Status Bar.
Git Repository
Likewise, we can use VS Code to initialize a git repository in our project.
- Click on the Source Control Activity button.
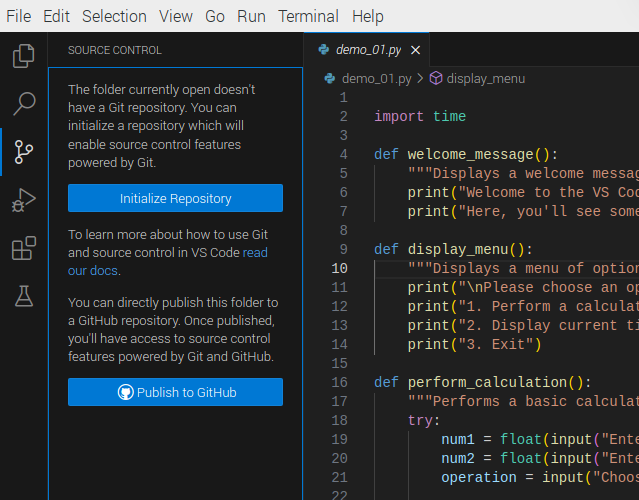
- Click the Initialize button.
Git Configuration
If you haven’t already configured Git on your system, you will need to run the following commands in a terminal (as the user of Visual Studio Code, not root).
git config --global user.email "you@example.com"
git config --global user.name "Your Name"
Git Integration
Now that we have initialized a repository, notice that the Primary Side Bar is divided into two major sections: Source Control and Source Control Graph.
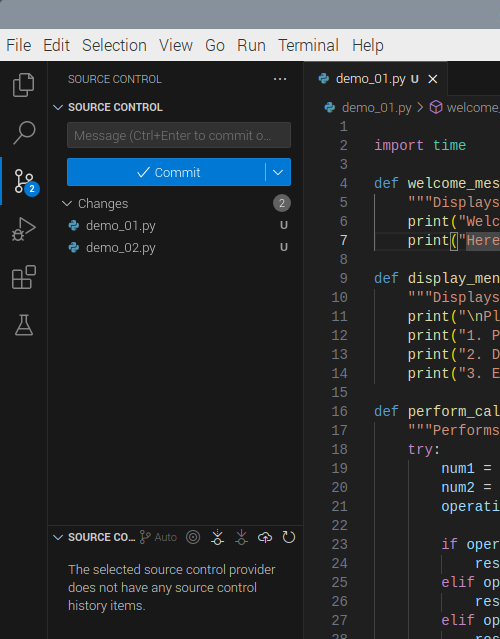
The Source Control section has different subsections depending on the state of your commit.
-
Changes: shows the files that are untracked or modified.
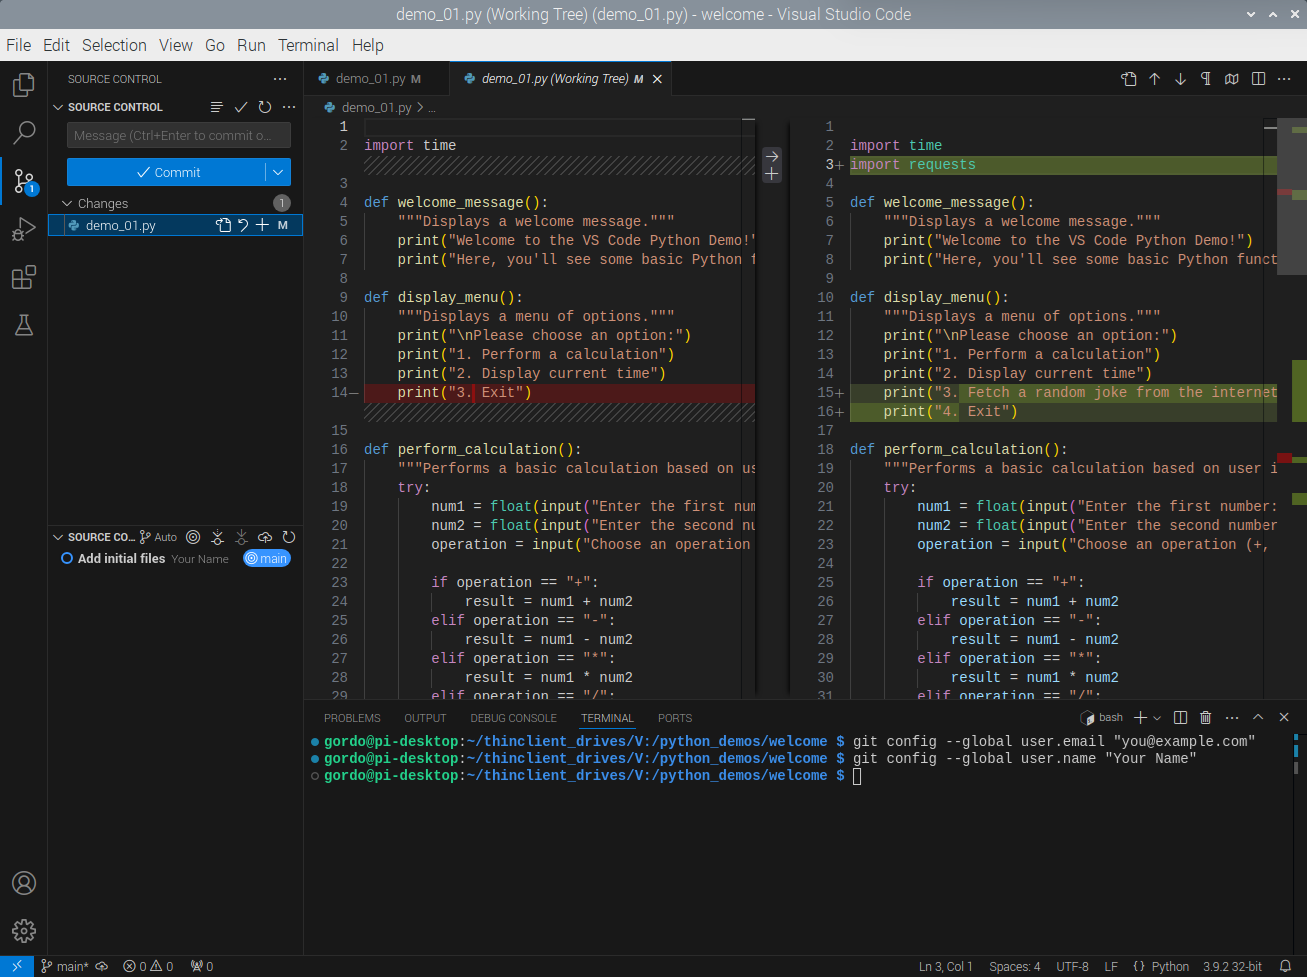
When you select a file, your file will be open in a side-by-side diff view, with the previous committed version of the file on the left, if any, and the changed version on the right. (Only the right-hand side is editable.) Green highlighted lines are inserts and red are deletes.
To the right of the filename, that’s selected in the Primary Side Bar, there are four icons (from left to right):
- Open File: to open it in an editor tab rather than as a diff view.
- Discard Changes: to revert the file back to the last commit state. [Use with caution!]
- Stage Changes: to do just that.
- ’U’ or ‘M’: for untracked (new file) or modified.
Click the Stage Changes (plus symbol) next to your project file. This is equivalent to
git add filename.Notice that the file appears in the new Staged Changes section.
-
Staged Changes: shows the file that are staged and ready to commit. (This section only appears when there are staged files.)
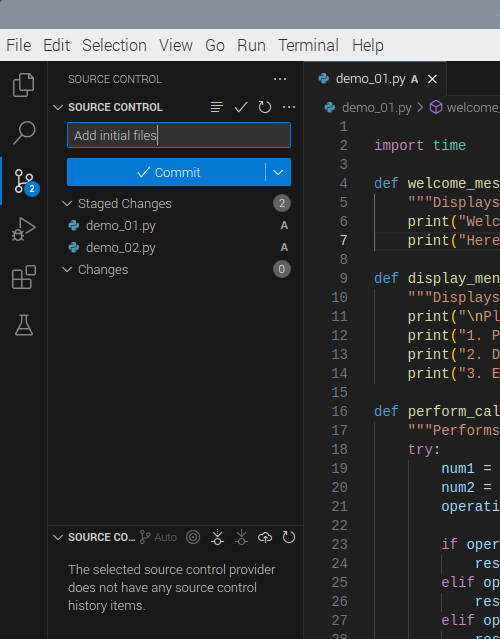
Once you have one or more files staged, you can commit them to your repository. Write a short descriptive commit message in the Message text box and then click Commit.
Your commit will now appear under the Source Control Graph. When you click on it, you’ll see another side-by-side of all the patches.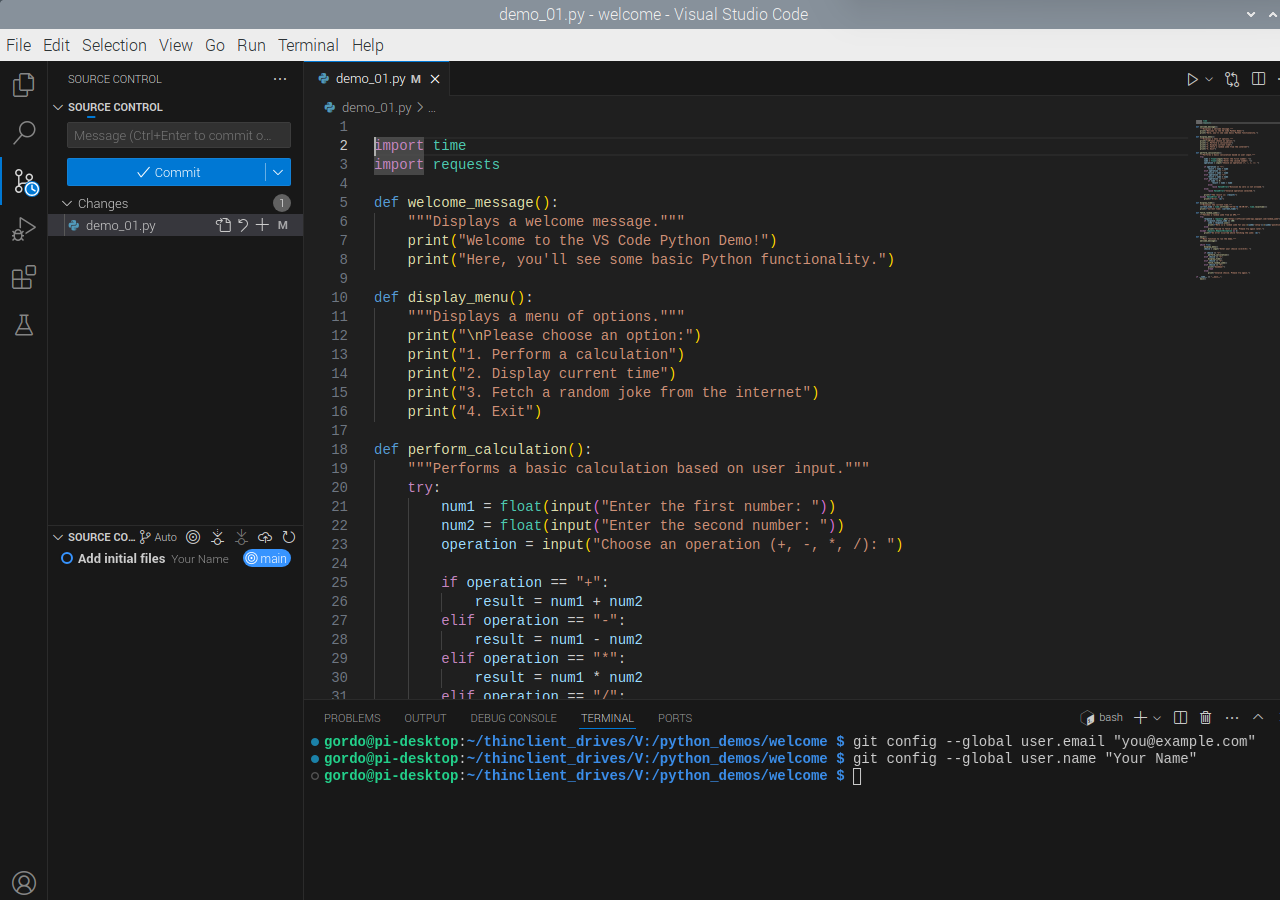
Tip: I like to keep each commit focused on a single, cohesive change,
so I always review the diff of each file, before staging them, in case
I need to remove any unrelated code. (Once you stage a file, you can
no longer see the diff view.) You can also stage a subset of the
files and commit them and repeat for the others as many times as
necessary.
Let’s make another change that we can commit to our repository:
- Return to your source code for editing.
- Change the order of the first two menu items.
Observe there are now blue and green bar(s) and red triangle(s) along the line numbers. The blue bars span the lines that have been changed; green bars are those lines that are new; and, the red triangles indicate where code was deleted.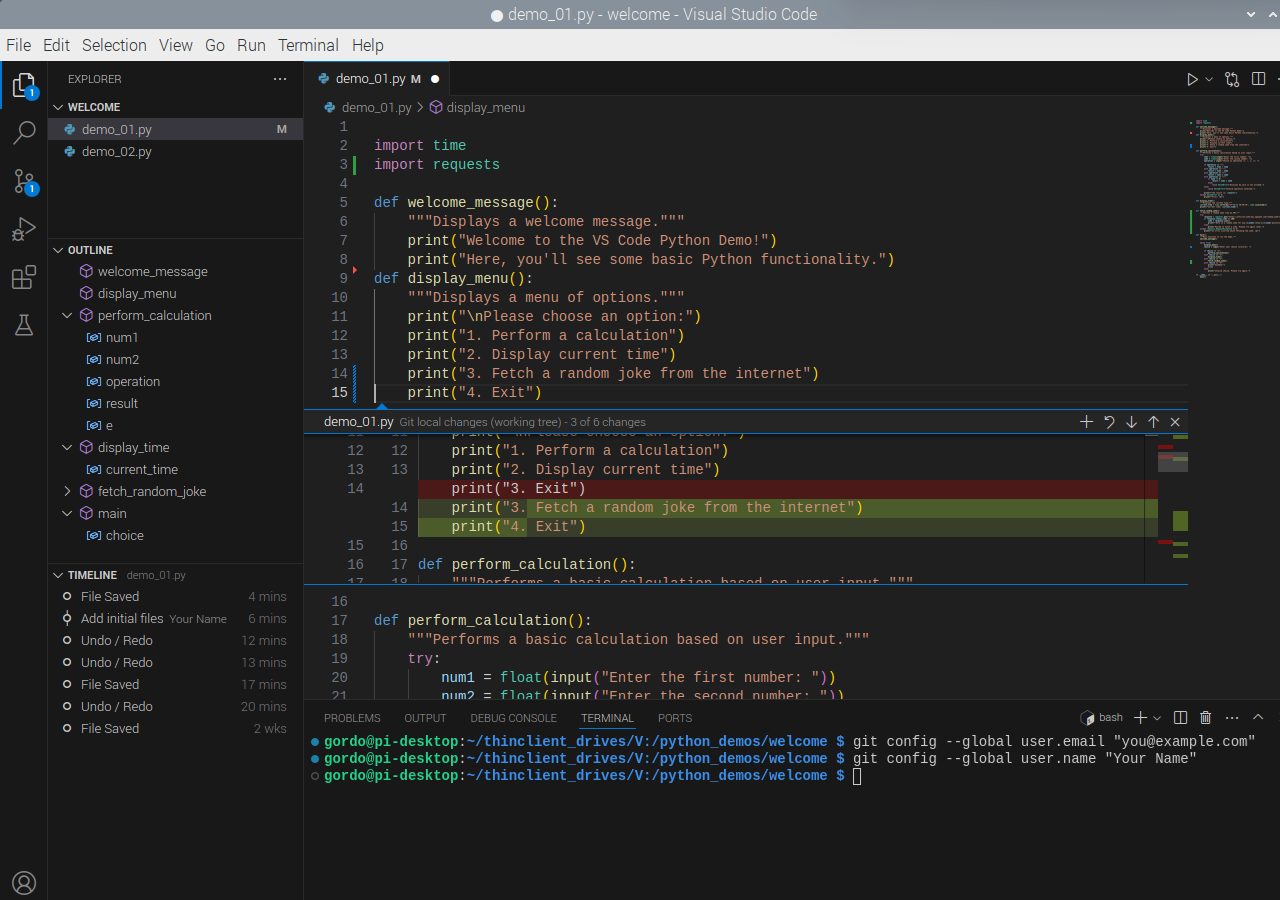
Clicking on one of those bars or triangles will open a floating horizontal diff showing you the changes. Click the Close (X) icon in the upper-right of the diff view to close it.
Switch to the Source Control activity and click on the file you just edited. Notice that the Minimap shows the general locations of your changes and the diff view shows the changes.
Click the Stage Changes button, type your commit message, and then click the Commit button. Rinse and repeat.
Debugging
The Python Debugger extension leverages debugpy and provides you graphical interaction to set breakpoints, step through code, inspect variables, and more.
Breakpoints and Execution
To engage the debugger, you need to set a breakpoint in your code first. Hover over the left side of the line number column and you should notice a dark red dot. Click on any line with code, except a function definition, and a bright red dot will appear. (The debugger will stop when a function is loaded but not during its execution.) Let’s set one on the line with, if operation == "+":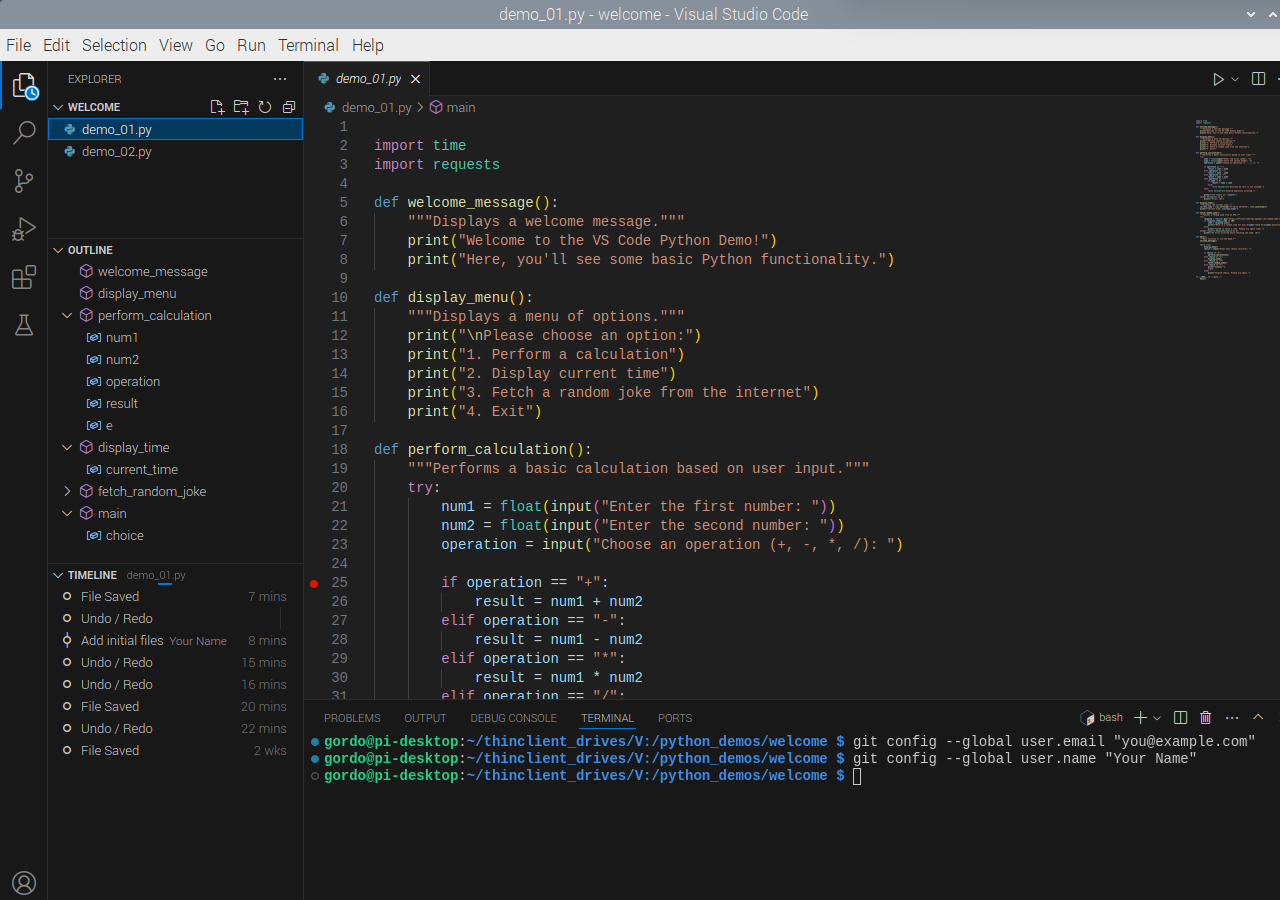
Before running the debugger, let’s also add a global class and a return value to the welcome_message() function. Notice how the breakpoint (red dot) stays with the statement where we set it.
class Foo:
    x = 5.0002

def welcome_message():
    """Displays a welcome message."""
    print("Welcome to the VS Code Python Demo!")
    print("Here, you'll see some basic Python functionality.")
    return 0
Click the chevron to the right of the ‘play’ button, and then click Python Debugger: Debug Python File. (We aren’t going to use the Run and Debug button in Primary Side Bar because it has more steps.) Code execution will pause on the line with the breakpoint.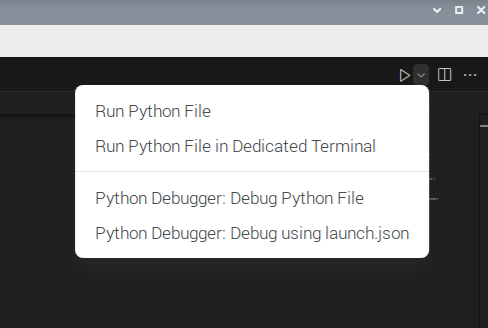
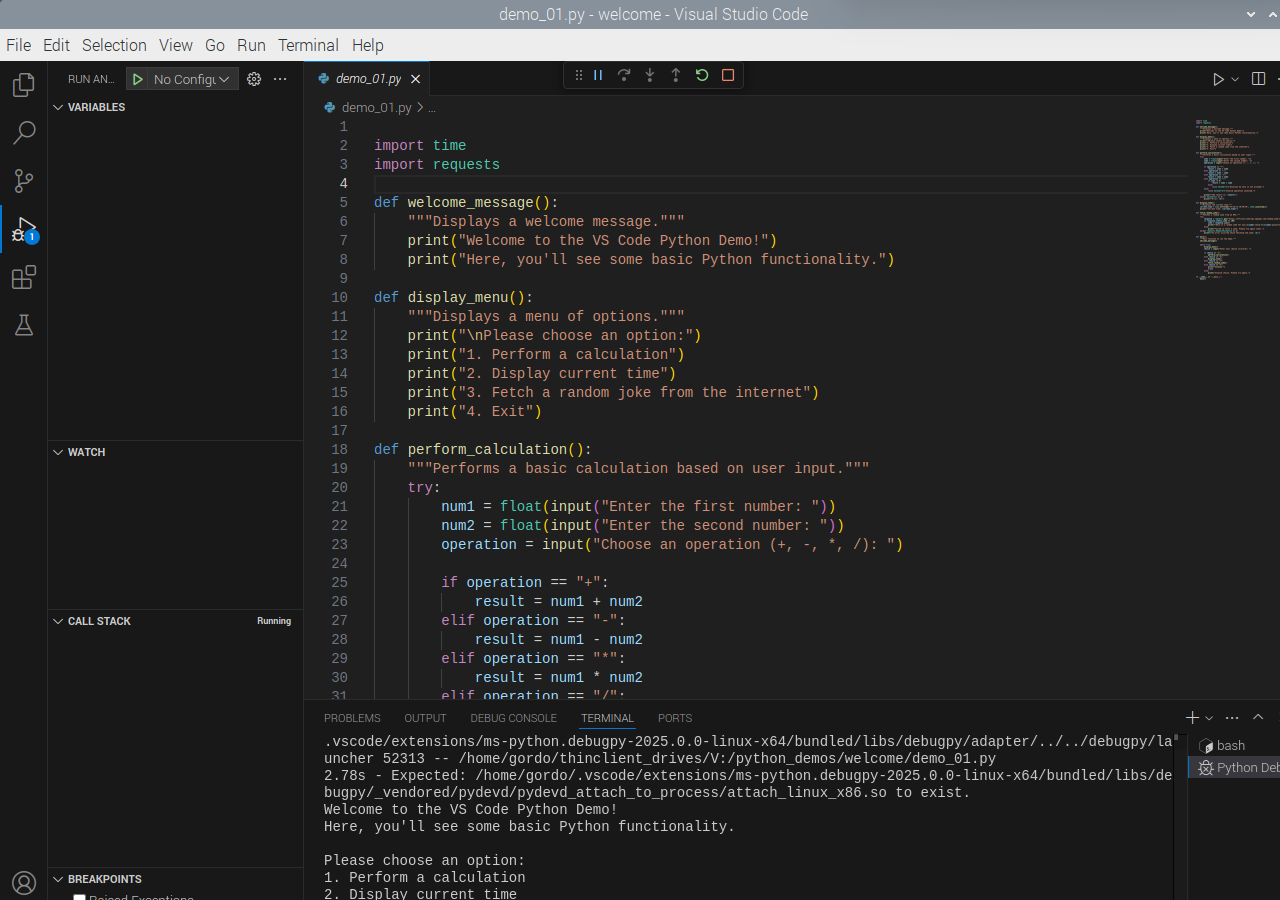
When the debugger is started, the Primary Side Bar changes to include three sections:
- Variables - includes subsections for Locals and Globals.
- Watch - user defined expressions or variables to monitor during debugging.
- Call Stack - tracks the sequence of function calls in a program, showing their order and context during execution.
Note that you can set additional breakpoints while debugging your code.
Variables and Watch
Once the breakpoint is hit and execution is paused, expand the Locals and you should see the three variables and the values you’ve entered.
Click the + (Add Expression) button to the right of the Watch section header. Type num1 into the Expression to watch text box. You should see that its value is identical to num1 in the Variables -> Locals section.
Repeat those actions and observe the results for the following statements:
num1 + num2num1 - num2num1 * num2num1 / num2num1 % num2
Try the following and observe:
welcome_message()Foo.x()

If you make a mistake or want to remove one of the watch statements, click the X (Remove Expression) icon.
Step Through Code
At the top-centre of the active file in the Editor, you’ll see a floating toolbar that contain the following icons (from left to right):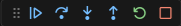
- Continue (F5) - continue execution until the next breakpoint or end of the script.
- Step Over (F10) - execute a function without debugging it.
- Step Into (F11) - execute a function with the debugger.
- Step Out (SHIFT+F11) - continue execution until the next breakpoint or the end of the function.
- Restart (CTRL+SHIFT+F5) - restart execution from the beginning.
- Stop (SHIFT+F5) - gracefully stop execution. (Unlike CTRL+C at the command line, which raises a KeyboardInterrupt and outputs a traceback to the terminal.)
Extensions
The Extension Marketplace contains about 60,000 extensions.
In addition to the required Python extensions, I’ve curated a lists of recommended and optional extensions that I find useful.
Required
- Python (Microsoft): https://marketplace.visualstudio.com/items?itemName=ms-python.python
- Python Debugger (Microsoft): https://marketplace.visualstudio.com/items?itemName=ms-python.debugpy
- Pylance (Microsoft): https://marketplace.visualstudio.com/items?itemName=ms-python.vscode-pylance
Recommended
- Black Formatter (Microsoft): https://marketplace.visualstudio.com/items?itemName=ms-python.black-formatter
- indent-rainbow (oderwat): https://marketplace.visualstudio.com/items?itemName=oderwat.indent-rainbow
- IntelliCode (Microsoft): https://marketplace.visualstudio.com/items?itemName=VisualStudioExptTeam.vscodeintellicode
- IntelliCode API Usage Examples (Microsoft): https://marketplace.visualstudio.com/items?itemName=VisualStudioExptTeam.intellicode-api-usage-examples
- IntelliCode Completions (Microsoft): https://marketplace.visualstudio.com/items?itemName=VisualStudioExptTeam.vscodeintellicode-completions
- Pylint (Microsoft): https://marketplace.visualstudio.com/items?itemName=ms-python.pylint
- Python Indent (Kevin Rose): https://marketplace.visualstudio.com/items?itemName=KevinRose.vsc-python-indent
- Vim (vscodevim): https://marketplace.visualstudio.com/items?itemName=vscodevim.vim
- gitignore (CodeZombie): https://marketplace.visualstudio.com/items?itemName=codezombiech.gitignore
Optional
- autoDocstring (Nils Werner): https://marketplace.visualstudio.com/items?itemName=njpwerner.autodocstring
- Bandit (Nicholas Hurley): https://marketplace.visualstudio.com/items?itemName=nwgh.bandit
- Better Comments (Aaron Bond): https://marketplace.visualstudio.com/items?itemName=aaron-bond.better-comments
- Bookmarks (Alessandro Fragnani): https://marketplace.visualstudio.com/items?itemName=alefragnani.Bookmarks
- Code Spell Checker (Side Street Software): https://marketplace.visualstudio.com/items?itemName=streetsidesoftware.code-spell-checker
- Data Wrangler (Microsoft): https://marketplace.visualstudio.com/items?itemName=ms-toolsai.datawrangler
- Git History (Don Jayamanne): https://marketplace.visualstudio.com/items?itemName=donjayamanne.githistory
- Jinja (wholroyd): https://marketplace.visualstudio.com/items?itemName=wholroyd.jinja
- Jinja Snippets (noxiz): https://marketplace.visualstudio.com/items?itemName=noxiz.jinja-snippets
- Mypy Type Checker (Microsoft): https://marketplace.visualstudio.com/items?itemName=ms-python.mypy-type-checker
Conclusion
Thank you for your time, attention, and interest in this presentation. Your engagement and feedback are greatly appreciated.
You should now have a better understanding of:
- what an IDE is;
- why VS Code is a useful tool;
- how to install VS Code;
- what the basic user interface elements are;
- how to configure a project; and,
- how to use Git and the debugger.
I’m happy to address any questions or discuss further insights.